Last Updated: May 2026
You're making million-dollar decisions with a spreadsheet.
Operator replaces the spreadsheet.
It tracks your portfolio, flags what matters, and gives you the numbers lenders actually look at.
Single-family rentals and long-term multifamily — one system of record.
Get Started FreeNo credit card. Free portfolio tracking forever.
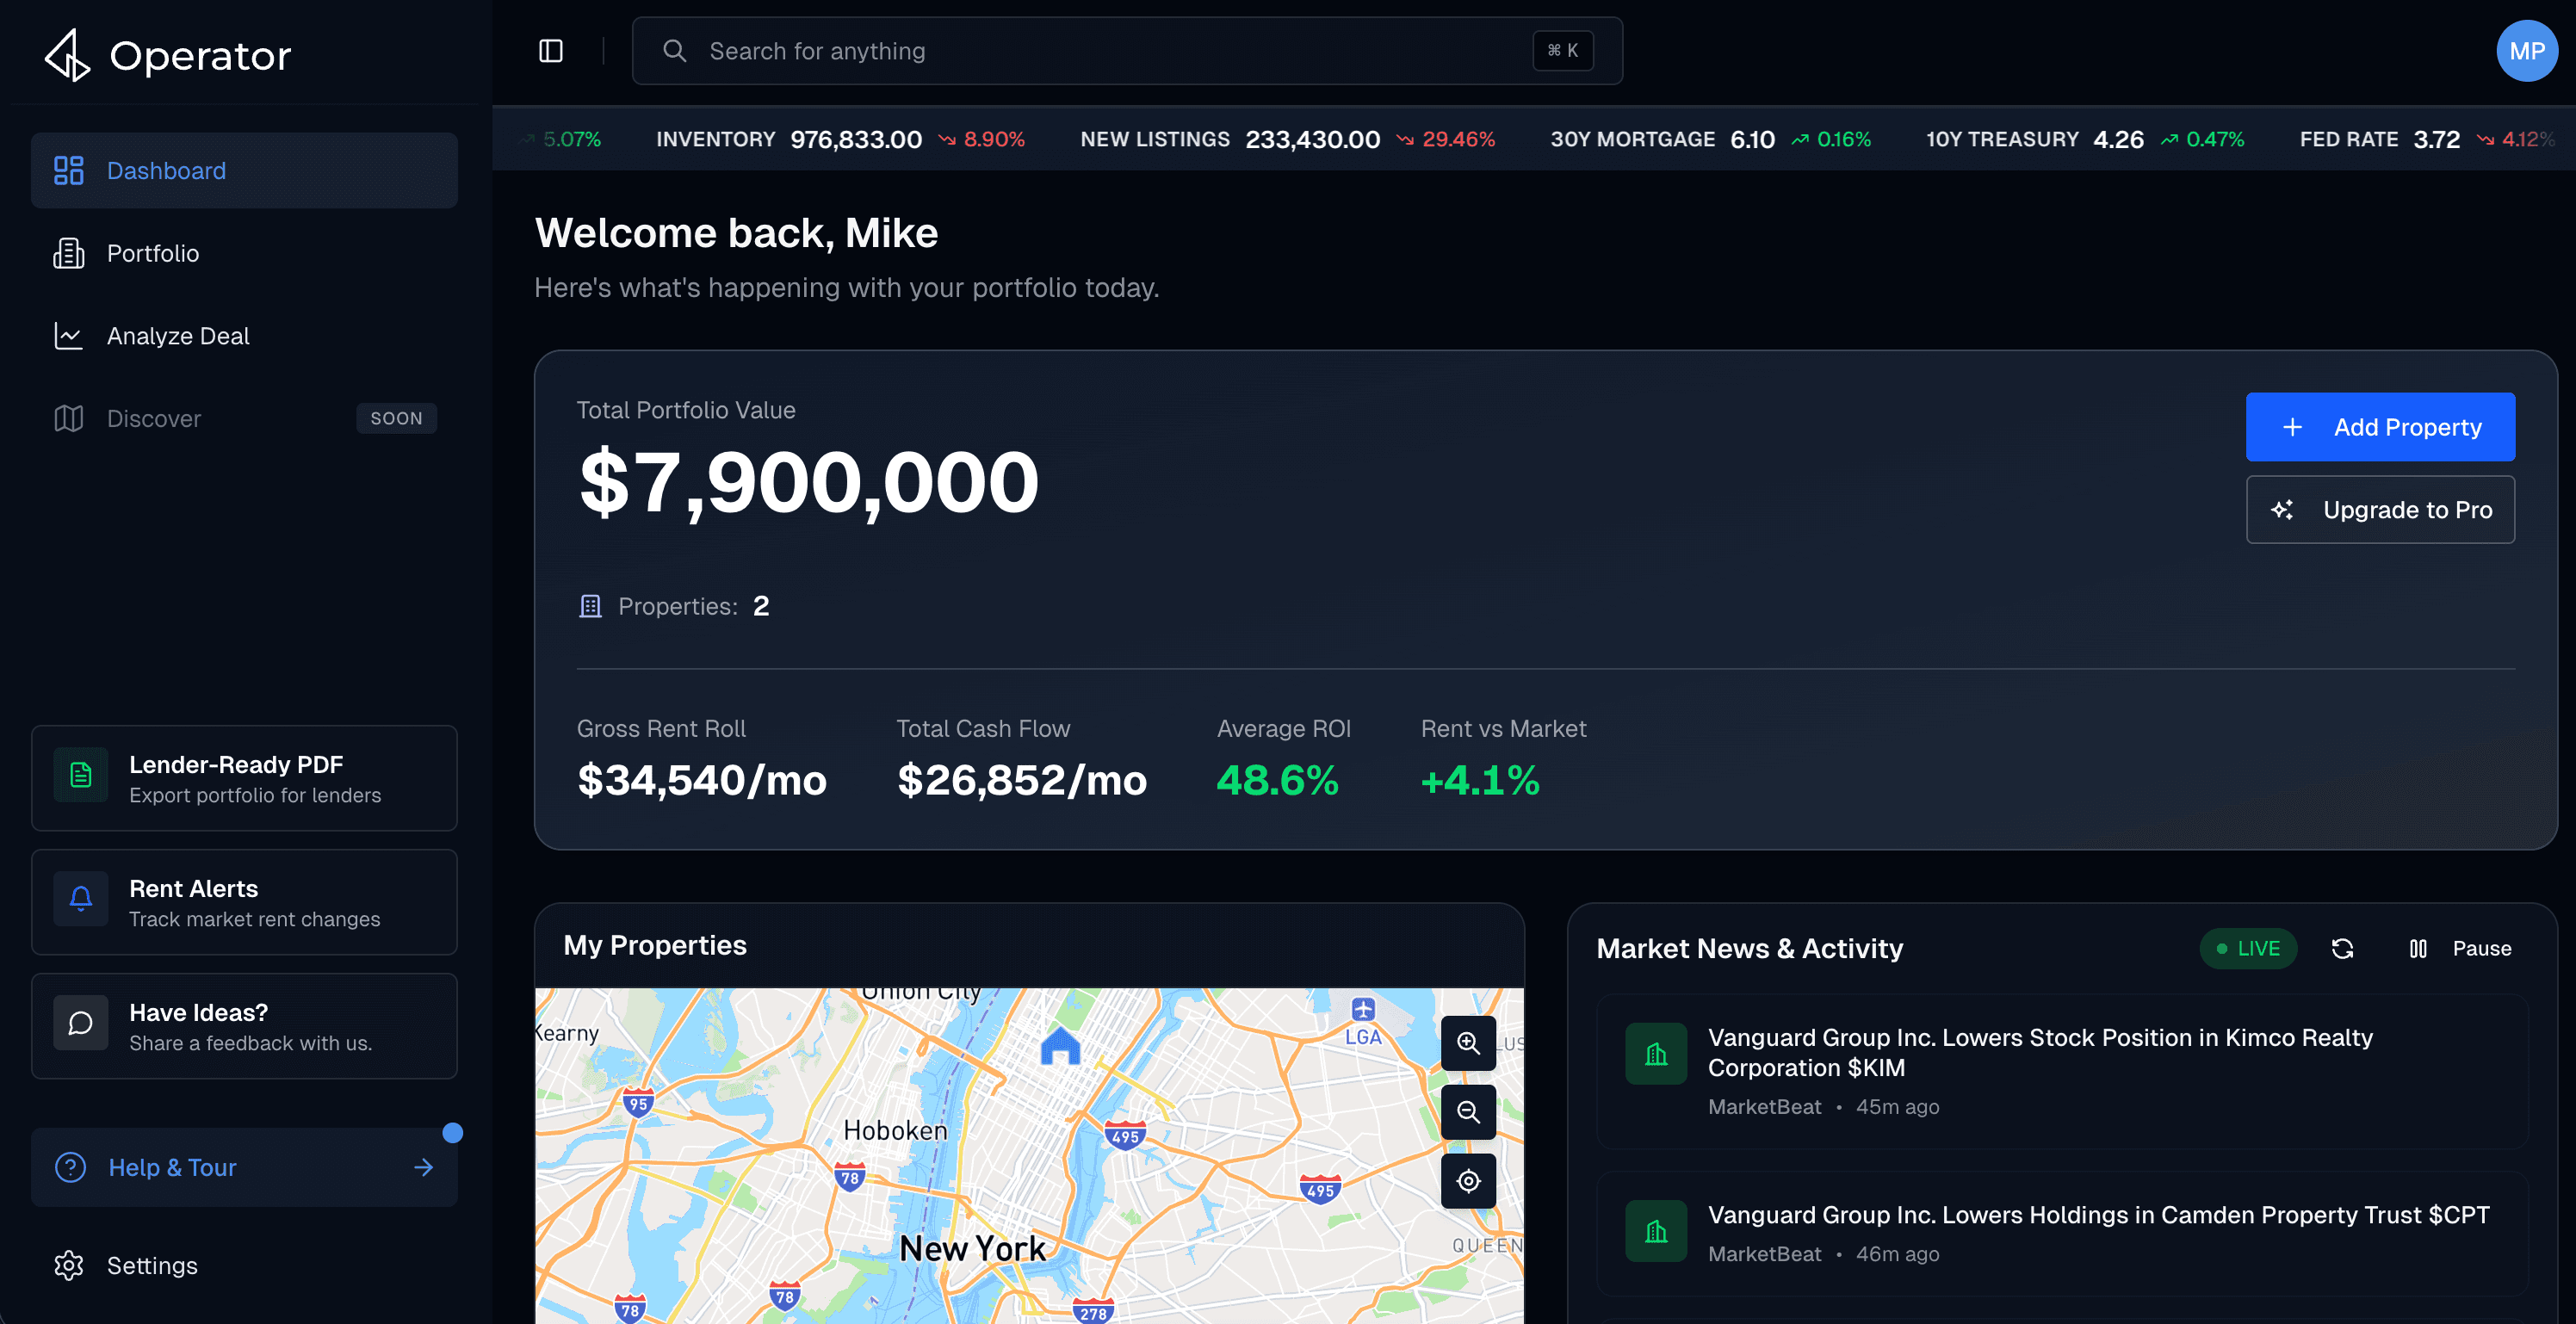
Portfolio-level intelligence
See how every property, every unit, and every deal affects your entire portfolio, not just one address. Any asset class.
Below-market alerts that protect your building's value
Ten units at $100/month under market compresses your building's value by over $171K. Operator catches it before you find out at sale.
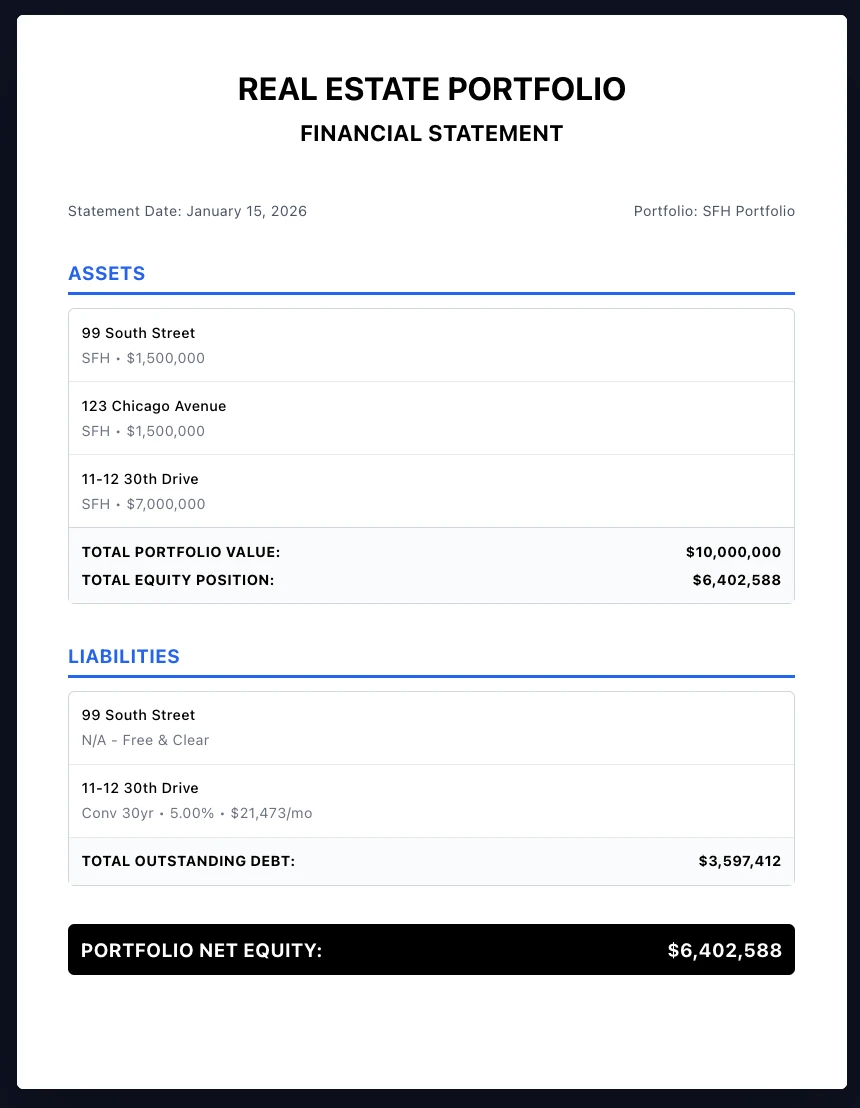
Lender-ready in 90 seconds
Generate professional portfolio reports that make underwriters take you seriously. No more rebuilding spreadsheets for every lender call.
You own rental properties. You're building something.
Maybe a few single-families. Maybe a small multifamily building. Maybe both. You're buying, selling, refinancing, analyzing deals. You're not looking for another app to learn. You're looking for infrastructure that makes the work you're already doing faster and sharper. If you manage 1 to 50 doors and make your own decisions, Operator was built for you.
Not another calculator.
Spreadsheets track what you type. Operator tracks what's actually happening: values, rents, market shifts, across your whole portfolio, automatically.
Deal calculators analyze one property at a time with no memory. Operator shows how each deal changes what you already own: cash flow, yield, leverage, concentration.
Net worth trackers show a number. Operator shows where you're losing money, where you're overexposed, and what to do about it.
SYSTEM OF RECORD
Know what you own. All of it. In one place.
Operator replaces the spreadsheet you've been maintaining since property number two.
Add properties once. We track value, income, equity, debt, and performance across every asset and every LLC.
Your structure is built in, not bolted on.
- Unlimited properties across asset classes
- Entity and LLC-level tracking
- Live portfolio metrics and cash flow
- Historical performance over time
Properties
20 East 50th Street
New York, NY 10022
MKT VALUE
$5,000,000
+25.0%
CAP RATE
7.9%
—
NOI
$396,000
—
CASH FLOW
$28,312 /mo
—
Property Metrics (6 units)
Purchase Price
$4,000,000
Total Cash Invested
$3,500,000
Down Payment
$3,500,000
ROI
35.7%
IRR
12.4%
Cash on Cash
9.7%
Rent Per Unit
$6,000 (per month)
Market Rent Per Unit
$5,005 (based on 306 samples)
Annual Variance
$71,640 (per year)
DSCR
7.04
Per Unit Metrics (Averages across 6 units)
PRICE/UNIT
$833,333
Market value
RENT/UNIT
$6,000
Per month
MARKET RENT/UNIT
$5,005
306 comps
NOI/UNIT
$66,000
Per year
CASH FLOW/UNIT
$4,719
Per month
RENT/VALUE
0.7%
Monthly ratio
| Unit | Rent/mo | Market Rent/mo | Variance | Other/mo | Beds | |
|---|---|---|---|---|---|---|
| Unit 1 | $7,000 | $5,570 | 25.7% | $0 | 2 | |
| Unit 2 | $6,200 | $5,100 | 21.6% | $0 | 2 | |
| Unit 3 | $5,800 | $4,900 | 18.4% | $0 | 1 |
Per unit, per month
$100
below market rent
10 units × 12 months
$12,000
in lost annual NOI
At a 7% cap rate
$171,000
in compressed building value
SYSTEM OF REASONING
Below-market rents don't just cost income. They compress value.
For properties over four units, value is driven by income. If rents lag the market, your building is worth less. Period.
Operator monitors every unit against live comps and shows you exactly how much value is leaking.
- Live rent monitoring by unit and location
- Per-unit gap and annual loss calculated automatically
- Direct valuation impact shown clearly
- Alerts before it turns into a six-figure problem
SYSTEM OF ACTION
Analyze every deal. Remember every one.
Most deal calculators are disposable. You run the numbers, screenshot it, and it disappears.
Operator saves every deal you analyze. Compare them side by side. When one closes, move it into your portfolio in one click.
Your deal history becomes an asset.
- Unlimited deal analyses for subscribers
- Every deal saved in your library
- Side-by-side comparison across saved deals
- One-click move to portfolio when you close
- Interactive financing with live IRR updatesNEXT
Portfolio Impact Analysis
How this deal would affect your portfolio performance
Current: $5,000,000
Projected: $7,000,000
+$2,000,000
Current: $36,000/mo
Projected: $51,000/mo
+$15,000
Current: 7.9%
Projected: 8.0%
+0.1%
Current: $396,000
Projected: $561,000
+$165,000
LENDER-READY EXPORTS
Walk into any bank looking like a fund.
Generate a professional portfolio report in 90 seconds.
Clean PDFs with entity structure, property detail, and the metrics underwriters care about.
Stop rebuilding spreadsheets every time someone asks.
PRICING
Start free. Scale when ready.
Start tracking your portfolio for free. Upgrade for professional-grade automation and intelligence.
Every deal changes the math.
Every other calculator assumes a blank slate. Operator shows how each acquisition or sale changes your entire portfolio: cash flow, yield, leverage, and concentration, before you make the offer.
Current Portfolio
IRR
14.2%
Cash-on-Cash
8.1%
Monthly Cash Flow
$8,200
With New Acquisition
IRR
12.4%
Cash-on-Cash
7.6%
Monthly Cash Flow
$9,800
HOW IT WORKS
Three steps. No spreadsheet.
Add your properties
Enter an address. Operator pulls market data, estimates current value, and sets up tracking. Single-family, multifamily, mixed-use, self-storage, notes: any asset class. Takes 60 seconds per property.
See what you're missing
Operator compares your rents to live comps, flags underperformance, and quantifies what it's costing you annually. One alert can pay for years of Operator.
Make better decisions
Model new deals against your existing portfolio. Export lender-ready reports. Stop guessing.
ROADMAP
What's live.
What's next.
| Release | Feature | Description | Status |
|---|---|---|---|
| v1.0 | Portfolio Dashboard | Full portfolio view with live metrics, property-level detail, entity tracking | LIVE |
| v1.1 | Property Value Estimates | Market-based value estimates updated continuously | LIVE |
| v1.1.1 | Below-Market Rent Alerts | Automated rent monitoring against live comps. Quantifies annual loss. | LIVE |
| v1.2 | Deal Analysis | Investment property analysis with IRR, cash-on-cash, cap rate | LIVE |
| v1.2.1 | Lender-Ready PDF Exports | Professional portfolio reports exportable in 90 seconds | LIVE |
| v1.3 | Multifamily Support | Full unit-level tracking for multifamily properties and mixed portfolios | LIVE |
| v2.0 | Interactive Financing Calculator | Toggle loan types, down payment, amortization. Watch IRR update live | NEXTMarch 2026 |
| v2.1 | Deal Library | Every deal you analyze is saved. Compare past analyses side by side. Move closed deals to your portfolio in one click. | NEXTMarch 2026 |
| v3.0 | Buy Box Monitoring | Define criteria, get daily digest of matching deals in your target zips | PLANNEDApril 2026 |
| v4.0 | Disposition Analysis | Model sell, hold, renovate, or seller-finance for every property. See which exit unlocks your next acquisition. | PLANNEDQ3 2026 |
FAQ
Frequently Asked Questions
Stop guessing.
Start Operating.
Free portfolio tracking. No credit card. Upgrade when it pays for itself.
Get Started Free