How to Analyze a Rental Property: The Framework That Separates Good Deals from Foreclosures
Analyzing a rental property means calculating pure cash flow: gross income minus every real expense including vacancy, CAPEX, and management, then dividing annual cash flow by total cash invested to get your cash-on-cash return, which should fall between 8% and 12% for a strong deal. Most investors skip half the expenses, buy on gut feel, and discover the real numbers after closing. This guide gives you the full framework so the math is settled before you make an offer.
Phantom Cash Flow Is How Investors Go Broke
Most rental property analyses look like this: $2,000 rent minus $1,400 mortgage minus $150 insurance minus $300 taxes equals $150/month cash flow. Deal done.
That's phantom cash flow. It ignores vacancy, capital expenditures, property management, repairs, and at least eight other line items that hit your bank account every year. Pure cash flow accounts for all of them. The difference between phantom and pure cash flow is often the difference between a property that builds wealth and one that drags you into foreclosure.
Every number below is about calculating pure cash flow, the only number that matters.
Square 1: Income
Start with gross rental income. Use a comparable market analysis or Rentometer to pull comps for the area; don't trust the listing agent's numbers.
Then look for additional income: pet rent, storage fees, laundry, premium add-ons. A four-bedroom house renting at $3,000/month could generate $4,800/month rented by the room at $1,200 each, an extra $21,600/year and, at a 5 cap, an additional $400,000 in property value.
The question isn't just "what does this property earn?" It's "what could this property earn?"
Square 2: Expenses
This is where deals die. Here's every category you need to account for:
Debt service: Principal and interest on your loan. With 30-year fixed rates running 5.9–6.2% nationally, debt service eats a much bigger share of rent than it did five years ago. A $258,750 loan at 6.0% costs $1,551/month, nearly $400/month more than the same loan at 4.0%.
Property taxes: The single most dangerous line item. Many counties reassess taxes when a property changes hands. A property showing $3,000/year in taxes that hasn't sold in 15 years could jump to $7,200/year after your purchase, turning $300/month cash flow into a $50/month loss. Call the county assessor before you make an offer and ask how reassessment works. Five-minute call. Could save you six figures.
Insurance: Get a quote. Don't estimate. Premiums have climbed 20–30% since 2022 in most markets.
Property management: 8–10% of gross rent if you're hiring out.
Vacancy: 5% is a common baseline for stable markets.
Repairs and maintenance: 5% of rent for newer properties (built after 2000), 10% for older ones.
CAPEX (capital expenditures): The replacement cost of major systems, amortized monthly. This is not repairs: patching drywall is a repair; replacing the roof is CAPEX. Every major component has a lifespan: roofs last 25–30 years ($12,000–$35,000 to replace), water heaters last 7–10 years (~$2,500 installed), HVAC lasts 15–20 years, appliances 10–15 years. Budget 5% of rent for newer properties, 10% for older. Ignoring CAPEX is the fastest way to convince yourself a bad deal is a good one.
Utilities: Water, sewer, garbage, electric, gas, only if you're paying them. Side-by-side duplexes with separated meters mean tenants pay their own, which is always the goal.
Other: Pest control, landscaping, snow removal, legal (LLC formation, lease docs), miscellaneous.
Never let a broker, agent, or seller do your math. Proformas routinely omit taxes and insurance. Run every number yourself.
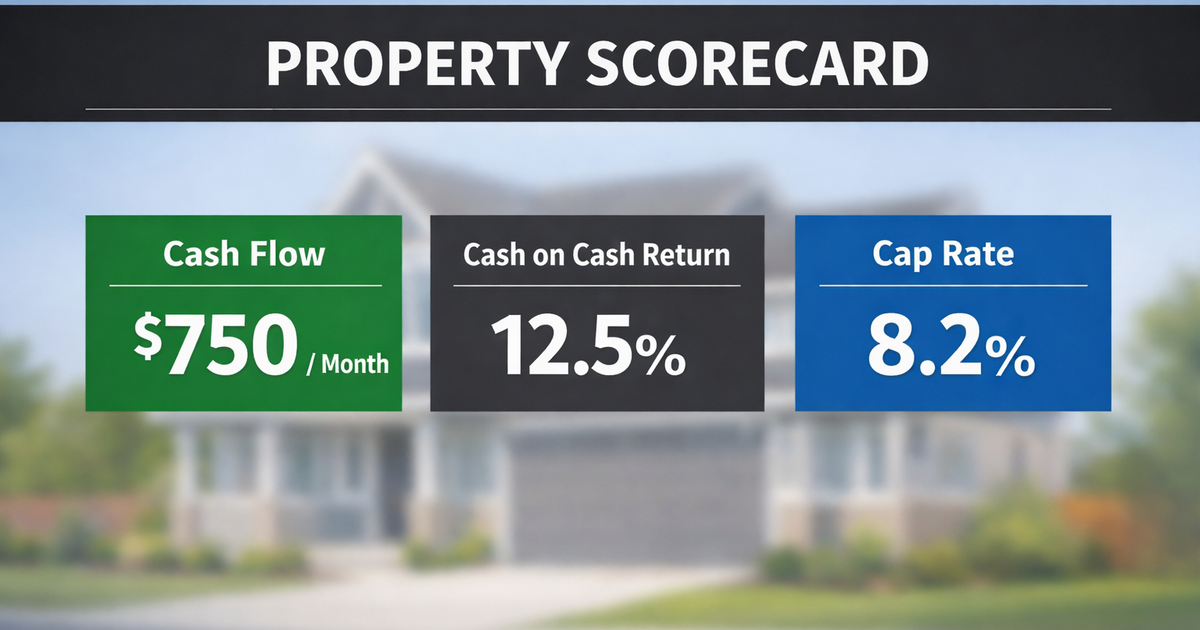
Square 3: Cash Flow
Total monthly income minus total monthly expenses equals pure cash flow. Target: at least $100/month per unit. That's the floor, not the goal.
Cash flow is your financial freedom number. Appreciation and equity paydown build long-term wealth, but cash flow is what replaces your W-2 income. Without it, you're subsidizing your investment out of pocket and hoping the market bails you out.
Square 4: Cash-on-Cash Return
$1,000/year in cash flow means nothing without context. On a $1M investment it's a disaster. On a $1,000 investment it's incredible.
Cash-on-cash return is annual pure cash flow divided by total cash invested (down payment + closing costs + rehab). Target: 8–12%. Below 8%, the deal needs a compelling appreciation thesis to justify.
Live Deal Walkthrough: Waco, TX Duplex
Here's the framework applied to a real listing: a side-by-side brick duplex, two 3BR/2BA units, two-car garage, built 2004, listed at the Waco duplex median of $345,000.
Income: Rent comps show $1,350–$1,450 for 3BR in the area. Conservative estimate: $1,400/unit = $2,800/month gross.
Expenses (at $345K asking price):
- 25% down ($86,250) + 3% closing costs ($10,350) = $96,600 total cash invested
- Loan: $258,750 at 6.0% fixed, 30-year amortization → $1,551/month P&I
- Taxes: $7,200/year post-reassessment ($600/month)
- Insurance: $1,800/year ($150/month)
- Vacancy: 5% ($140/month)
- Repairs: 5% ($140/month, newer build)
- CAPEX: 5% ($140/month, newer build)
- Management: 10% ($280/month)
- Tenant-paid utilities (separated meters, individual yards)
Total monthly expenses: $3,001
Result at $345K: -$201/month cash flow. Cash-on-cash return: -2.5%. The deal loses money from day one.
This is what a 6% rate environment does to median-priced properties. The same duplex at 4.5% and $280K four years ago penciled at +$215/month. Today, at market price, it's underwater.
What Needs to Be True for This Deal to Work
Every deal has a price that makes it work, and a set of conditions that make it work at a higher price. Here are the three levers, applied to this duplex.
Lever 1: Buy below market.
The purchase price is the only variable that moves both debt service and total cash invested. At $345K, this deal is $200/month negative. Working backward:
To break even, you need to buy around $300K, 13% below asking. To hit $100/unit, you're looking at $280K, 19% below asking. To reach the 8% cash-on-cash floor, you need roughly $215K, 38% below asking.
At market price, this deal doesn't exist on the MLS. That's why off-market deals and the BRRRR strategy exist; they let you manufacture the discount that makes return targets achievable.
Lever 2: Increase income.
If the purchase price is fixed, the rent has to do the work. At $345K with professional management, here's what each rent level produces:
You need roughly $1,575/unit just to break even at $345K, 12% above current market rent. Getting there means adding real value: washer/dryer hookups, updated kitchens, covered parking, pet-friendly policies with pet rent, or renting furnished.
Lever 3: Self-manage.
Dropping the 10% management fee ($280/month) is the fastest way to move the needle. At $345K with self-management:
- At $1,400/unit: +$79/month ($40/unit). Still under the $100/unit floor.
- At $1,500/unit: +$249/month ($125/unit). Passes the unit floor. Cash-on-cash: 3.1%.
- At $1,600/unit: +$419/month ($210/unit). Cash-on-cash: 5.2%.
Self-management alone doesn't save this deal at market price. But self-management + a modest rent premium ($100–$200/unit above market) gets you positive cash flow and past the $100/unit floor.
The realistic play on this duplex: Buy at $280K–$300K through off-market sourcing or negotiation, self-manage for the first two years, push rents to $1,500/unit with light value-add, and you're looking at $300–$400/month cash flow with a 5–7% cash-on-cash return. Not a home run, but a solid base hit that builds equity while covering its own costs.
At $345K on the MLS with a property manager? Walk away. The math doesn't work at today's rates.
Stop Doing This in a Spreadsheet
This framework works on paper, in a calculator, or in a spreadsheet. But if you own more than one property, tracking income, expenses, CAPEX reserves, and return across your portfolio in a spreadsheet stops scaling fast.
Operator runs this analysis with live market data: rent comps update automatically, cash-on-cash return recalculates as your loan amortizes, and you can export lender-ready PDF reports when it's time to refi or buy the next deal. $25/month for your entire portfolio.
Run your first deal through Galleon's rental property calculator →
FAQ
What is a good cash-on-cash return on a rental property? A strong cash-on-cash return falls between 8% and 12%. Below 8%, the deal needs a compelling reason, such as high expected appreciation or a below-market purchase price through BRRRR, to justify the lower yield. Cash-on-cash return is calculated by dividing your annual pure cash flow by the total cash you invested in the deal.
How much cash flow should a rental property produce? A minimum of $100 per month per unit in pure cash flow, meaning after every expense is accounted for, including vacancy, CAPEX, management, and reserves. This is a floor. Many experienced investors target $150–$200/unit/month or higher depending on the market.
What is CAPEX in rental property investing? CAPEX (capital expenditures) is the cost of replacing major property components over time: roof, HVAC, water heater, appliances, windows, plumbing. It's different from repairs. Budget 5% of gross rent for newer properties and up to 10% for older ones. Failing to account for CAPEX is the most common reason investors overestimate cash flow.
What expenses do most investors forget when analyzing a rental property? The most frequently missed expenses are CAPEX reserves, property tax reassessment after purchase, vacancy (even good properties sit empty between tenants), and property management fees. Broker proformas regularly omit taxes and insurance entirely. Always run your own numbers.
Why do most rental properties look worse at today's interest rates? With 30-year fixed rates at 5.9–6.2%, debt service consumes a much larger share of rental income than it did when rates were 3–4%. A property that cash-flowed at $300/month in 2021 may be negative today at the same purchase price. This means purchase price discipline matters more than ever; the margin for error is gone.
How does Operator help with rental property analysis? Operator by Galleon tracks your portfolio's cash flow, monitors rents against live market comps, calculates cash-on-cash return as your loans amortize, and generates lender-ready PDF reports. It replaces the spreadsheet most investors use to track their rentals. $25/month, unlimited properties.