To find distressed properties in listing data, look for homes that have sat far past the local median days on market, taken a string of small price cuts, been pulled and relisted, or expired, especially when the ask was set back when mortgage rates were lower. Then offer below asking, with each offer sized by your own cash-on-cash and DSCR targets instead of a percentage off list.
Key takeaways
- Foreclosures and short sales were only 2% of existing-home sales in October 2026, so most of the distress you can buy today sits in regular listings that aren't selling.
- NAR's national median time on market was 35 days in October 2026, so a listing at three or four times your local median deserves a closer look.
- A ladder of small price cuts usually means the seller is following the market down without catching it.
- Your offer should come from the highest price that still meets your cash-on-cash and DSCR targets at your real loan terms.
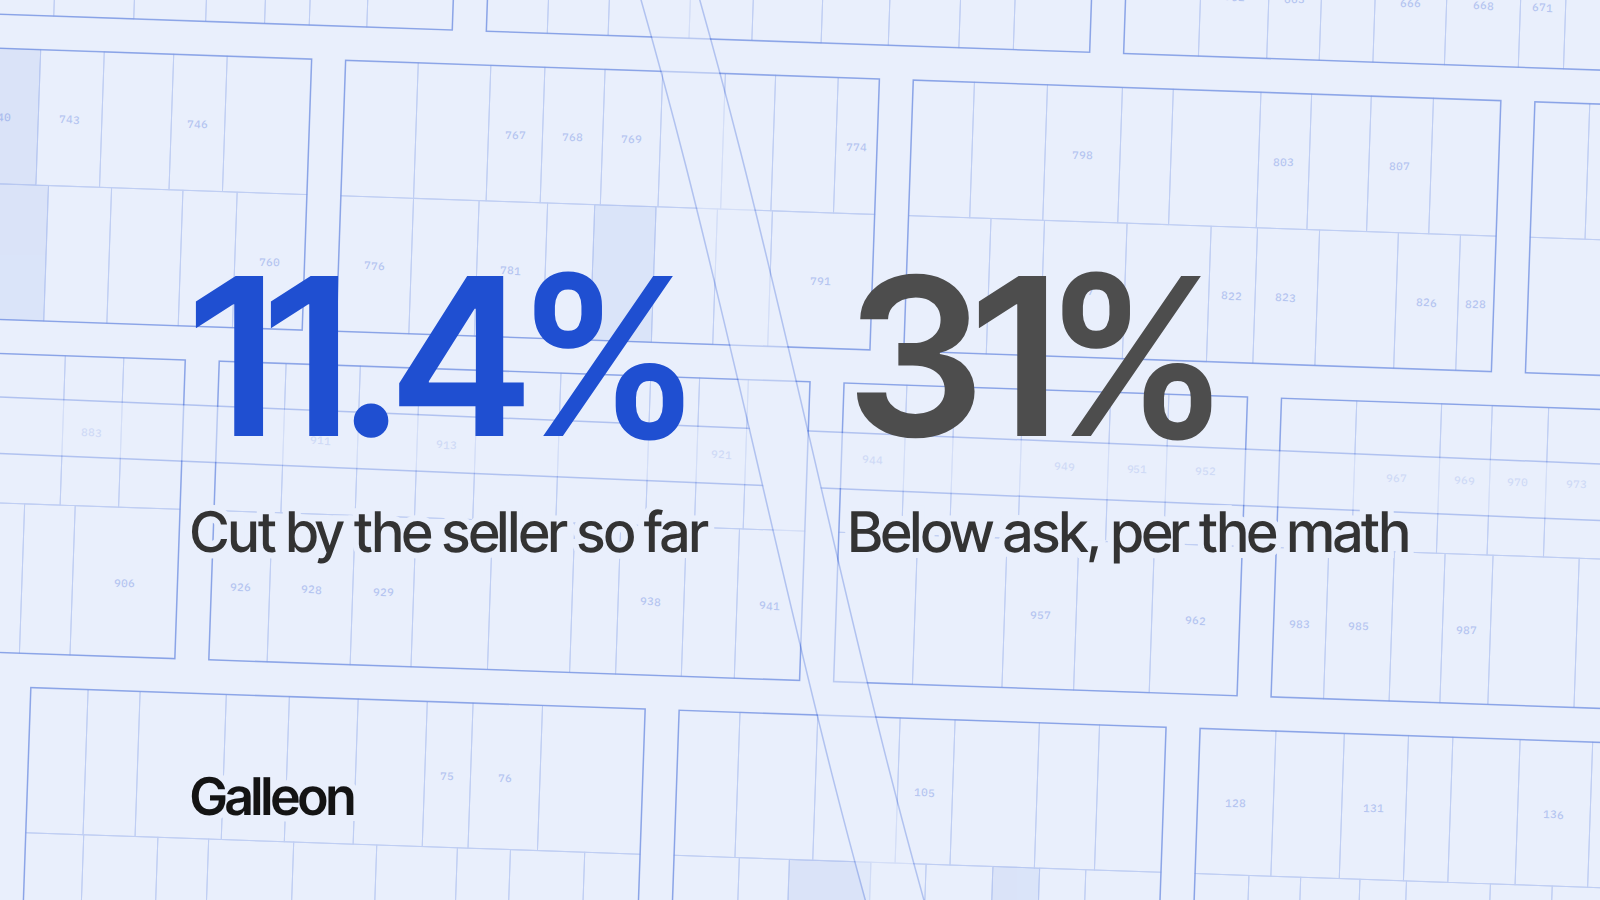
- In our example, the seller has cut the price 11.4%, and the max offer still lands about 31% below the ask.
Why look for distress in listings right now?
Most of the distress a small investor can buy sits in regular listings. Foreclosures and short sales made up just 2% of existing-home sales in October 2026, according to NAR's October existing-home sales release (published November 12, 2026). The other 98% were regular sales, and plenty of regular sellers are getting worn down.
Sales fell 5.5% from September to a seasonally adjusted annual rate of 3.75 million, down 8.8% from a year earlier. NAR's chief economist, Lawrence Yun, called it the lowest level since August 2010. Supply grew to 5.1 months, up from 4.4 months a year before, and the median home took 35 days to sell.
Rates are the other half of the story. Freddie Mac's weekly mortgage rate survey had the 30-year fixed at 7.11% as of November 12, 2026, versus 6.24% a year earlier. A seller who priced off last year's sales is asking buyers to pay last year's price at this year's rate, and many won't.
Investors are still buying: individual investors and second-home buyers were 20% of October 2026 sales, up from 16% a year earlier, per NAR. If you'd rather work homes that never get listed, see our guide to finding off-market properties.
What counts as a distressed property?
The textbook answer is a home in foreclosure, a short sale or a property with tax liens. For a buy-and-hold investor reading listing data, a more useful version is a listing where the seller's price and the market have drifted apart and time is wearing on the seller. The owner may be in fine financial shape, but the strain shows up in the listing history, where you can see it.
Which listing signals point to a seller ready to deal?
Pull up the full listing history, not just today's ask. These five signals matter most.
Long days on market
Compare days on market (DOM) with a local benchmark. NAR's national median was 35 days in October 2026, up from 34 a year earlier, but your market will differ, so ask a local real estate agent for MLS stats. A listing at three or four times the local median has been seen by every active buyer in town, and none of them paid the ask.
A ladder of small price cuts
One big cut usually means the seller reset to the market. A ladder of small cuts, 2% to 4% every month or so, means the seller keeps following the market down without catching it, and each cut buys a few more weeks of hope. That's the pattern we look for most.
Withdrawn, then relisted
A home pulled off the market and put back up a few weeks later can look brand new in search results, and depending on the MLS it may show a fresh days-on-market count. Ask for cumulative days on market and the full price history so a relist doesn't hide how long the home has really been for sale.
Expired listings
An expired listing reached the end of its listing agreement without selling, so the owner still has the house and wanted to sell it recently. Expired and withdrawn listings sit right on the line between on-market and off-market, and a clean, respectful offer can land well with an owner who's tired of waiting.
An ask set when rates were lower
Check when the price was first set. A home listed in late 2025, when Freddie Mac's 30-year average was 6.24%, was priced for buyers borrowing near that rate. At 7.11%, the same monthly payment supports a smaller loan, and a seller who hasn't caught up is often the one cutting in small steps. The rate table further down shows how much that gap moves your offer.
How do you size an offer on a long-listed property?
Work backward from your targets. A percentage off list (say, 10% under asking) ties you to the seller's number, and the seller's number is the thing that isn't working. If you're still choosing targets, our post on a good cash-on-cash return walks through how investors set them.
- Estimate net operating income (NOI): rent after vacancy, minus taxes, insurance, maintenance, capex and management. Base rent on real rental comps, not the listing's pro forma.
- Set your targets. Here they're 6% cash-on-cash and a DSCR of 1.20 (NOI divided by annual debt service).
- Solve for the highest price that meets each target at your real loan terms.
- Take the lower of the two prices. That's your max offer.
- Compare it with the ask and decide whether to send it.
Worked example: a 3-bed that won't sell
This is a made-up listing: a 3-bed single-family home in a smaller Midwest market, priced below NAR's October 2026 Midwest median of $324,300.
| Day on market | Asking price | Cut |
|---|---|---|
| 0 | $269,900 | n/a |
| 35 | $259,900 | -3.7% |
| 70 | $252,500 | -2.8% |
| 100 | $247,500 | -2.0% |
| 130 | $239,000 | -3.4% |
That's 130 days on market, about 3.7 times NAR's 35-day national median, and four cuts totaling 11.4%. Here are the assumptions (Example, not a quote):
| Input | Example value |
|---|---|
| Market rent | $2,150 a month |
| Vacancy | 6% of gross rent |
| Maintenance, capex, management | 8%, 5% and 9% of gross rent |
| Property tax, insurance | $3,100 and $1,700 a year |
| Loan | 25% down, 7.75%, 30-year amortization |
| Closing costs, repairs | 3% of price, $6,000 |
| Targets | 6% cash-on-cash, DSCR of 1.20 |
The 7.75% rate is Freddie Mac's 7.11% (as of November 12, 2026) plus about 0.65 point we assumed for an investor loan. Don't forget to swap in your own rent, taxes, insurance and lender quote. Our guide on how to analyze a rental property covers each input.
NOI comes to $13,776 a year at any price: $24,252 in rent after vacancy, minus $10,476 in expenses. Only the loan and the cash you put in change with the price.
| Example | At the $239,000 ask | At a $165,100 max offer |
|---|---|---|
| NOI | $13,776 | $13,776 |
| Annual debt service | $15,410 | $10,645 |
| Cash flow per year | $1,634 loss | $3,131 |
| Cash invested | $72,920 | $52,228 |
| Cash-on-cash | -2.2% | 6.0% |
| DSCR (NOI ÷ debt service) | 0.89 | 1.29 |
| Cap rate | 5.8% | 8.3% |
At the ask, the house loses $1,634 a year. To hit 6% cash-on-cash, the most you can pay is about $165,100, which is about 31% below the $239,000 ask. The DSCR target alone would allow about $178,000, so cash-on-cash is the test that decides it.
The seller has cut 11.4%, and the math still puts the max offer about 31% below the ask.
The lender's ratio can pass while you lose money
Many DSCR lenders compare monthly rent with the full payment: principal, interest, taxes, insurance and any HOA dues (PITIA), and 1.25 is a common minimum. At the $239,000 ask, $2,150 in rent over a payment of about $1,684 gives 1.28. A lender could approve this loan while the property loses money every year, because that ratio leaves out vacancy, repairs and management. Check how your lender defines it, and see our DSCR loan guide for details.
Watch out: Passing the lender's test only means you can get the loan. Use your own cash-on-cash and NOI-based DSCR targets to decide what to pay.
How rates move your max offer
Here's the 6% cash-on-cash max offer for the same house at different loan rates. Cash-on-cash sets the limit at every rate shown.
| Loan rate | Max offer at 6% cash-on-cash | Below the $239,000 ask |
|---|---|---|
| 6.50% | $182,100 | 23.8% |
| 6.90% | $176,400 | 26.2% |
| 7.25% | $171,600 | 28.2% |
| 7.75% | $165,100 | 30.9% |
| 8.25% | $158,900 | 33.5% |
Each half point of rate takes about $6,200 to $6,500 off what you can pay. At 6.9%, which is last year's 6.24% Freddie Mac rate plus the same markup, you could pay about $11,300 more than at 7.75%. That's the gap a seller who priced in a lower-rate year is up against.
How many low offers should you send?
More than feels comfortable. A seller who's ready to deal can only say yes to an offer someone actually sends, and on a home that's been sitting for months, you may be the only buyer who does. Most offers will miss, and that's normal, because a low offer backed by real numbers is still a serious offer. A few habits help:
- Include a short note on how you got your number (rent, expenses, rate).
- Keep your terms clean so price is the only real gap.
- Track every no, since your number may suddenly be close if the seller cuts again.
- Don't raise your max to win. If the deal only works above it, let it go.
Where software helps and where you take over
Finding the listings is the tedious part. Operator is the system of record for your properties, and it runs two agents today: the Buy Box Agent and the Rent Monitoring Agent. The Buy Box Agent checks on-market and off-market properties every day against the location, property type and signals you set (such as vacant, absentee owner or pre-foreclosure, where the county records them). It sends new matches with a 0 to 100 Buy Box score and pricing against estimated value, and it flags new listings and price changes, so a fresh cut on a matching home doesn't slip past you. From there the work is yours: read the full price history, run the offer math above at your own lender's terms and decide which offers to send.
Last updated November 19, 2026. Market figures are dated where they appear.
This is general information, not tax, legal or lending advice. Talk to your CPA, attorney or lender about your situation.
FAQ
What is a distressed property?
Traditionally, it's a home in foreclosure, a short sale or a property with unpaid tax liens. For investors reading listings, it also means a for-sale home where the price and the market have drifted apart, which shows up as long days on market, repeated price cuts, relists or an expired listing.
How long do houses stay on the market right now?
NAR's median was 35 days in October 2026, up from 34 a year earlier. Local numbers vary a lot, so compare a listing with its own market.
Does relisting a home reset days on market?
It can, depending on the MLS. Ask for cumulative days on market and the full price history.
What's the difference between an expired and a withdrawn listing?
An expired listing reached the end of its listing agreement without selling. A withdrawn listing was taken off the market before the agreement ended. Status rules vary by MLS, but in both cases the owner wanted to sell recently, which makes the property worth tracking.
How low should a low offer on a house be?
As low as your math says. Solve for the highest price that meets your cash-on-cash and DSCR targets at your real loan terms, and offer at or below it. In our example, that landed about 31% below asking, even after the seller had already cut 11.4%.